Showing posts with label graphs-statistical-analysis. Show all posts

May 22, 2024

Google Summer of Code 2024


Welcome to the new Google Summer of Code scholars for 2024! INCF is sponsoring four students for which I (Bradly Alicea) am acting as mentor: two students for the DevoWorm group (via the OpenWorm Foundation community) and two students for the Orthogonal Research and Education Laboratory. 


D-GNNs (sponsored by the DevoWorm group)

Congratulations to Pakhi Banchalia and Mehul Arora for being accepted to work on the Developmental Graph Neural Networks (D-GNNs) project. Pakhi will be working on incorporating Neural Developmental Programs (NDPs) into GNN models. Mehul will be working on hypergraph techniques for developmental lineage trees and embryogenesis [1]. Himanshu Chougule (Google Summer of Code scholar) is a co-mentor for this project.

Virtual Reality for Research and Open-source Sustainability (sponsored by the Orthogonal Research and Education Lab)

Congratulations to Sarrah Bastawala for being accepted to work on the Open-source Sustainability project [2]. Sarrah is incorporating Large Language Models (LLMs) into the collection of agent-based approaches for this project. Jesse Parent is a co-mentor for this project.

We also have two Open-source Development scholars for Summer 2024: Adama Koita and Shubham Soni. They will be participating in the Orthogonal Lab's open-source weekly meetings in addition to projects based around Virtual Reality and Open-source Sustainability, respectively. 

May 8, 2023

Google Summer of Code 2023

Welcome to the new Google Summer of Code scholars for 2023! INCF is sponsoring four students for which I (Bradly Alicea) am acting as mentor: two students for the DevoWorm group (via the OpenWorm Foundation community) and two students for the Orthogonal Research and Education Laboratory. These four students are pursuing three projects.


D-GNNs and DevoLearn (sponsored by the DevoWorm group)

Congratulations to Himanshu Chougule and Sushmanth Reddy Mereddy for being accepted to work on the Developmental Graph Neural Networks (D-GNNs) project. Sushmanth has been contributing to the DevoLearn platform for quite some time and will spend this summer working on improving the image segmentation to GNN embedding pipeline. Himanshu was a part of last Summer's GSoC cohort in the Orthogonal Research and Education Laboratory, working on the Open-source Sustainability project. His work resulted in developing Agent-based Model-Reinforcement Learning hybrid models. This year, he will be working on building Topological Data Analytic capabilities into the D-GNN pipeline. 

Mayukh Deb and Jiahang Li are co-mentors for this project.

Virtual Reality for Research and Open-source Sustainability (sponsored by the Orthogonal Research and Education Lab)

Congratulations to Vrushali Nandurkar and R.V. Rajagopalan for being accepted to work on the projects Virtual Reality for Research and Open-source Sustainability, respectively. Vrushali is enthusiastic about working on creating open-source virtual world assets for scientific research and educational initiatives. R.V. will be working on a continuation of the Open-source Sustainability project, helping to augment the existing models and web interface.

Jesse Parent is a co-mentor for both projects, while Brian McCorkle is a co-mentor for the Open-source Sustainability project. 

December 23, 2022

Learning on Graphs (LoG) conference recap


The Learning on Graphs (LoG) conference took place from December 9-12 and featured a broad diversity of research on Graph Neural Networks (GNNs). GNNs [1] encompass a relatively new area of machine learning research which have a number of interesting connections to applied math and network science. The daily sessions (keynote talks and oral presentations), in addition to the seven workshop sessions, are available from the conference YouTube channel.

GNNs are a way to take data that yield graphical relationships in the real world and analyze then using the power of neural networks. While GNNs are specialized for problems that can be represented as a graph (discrete, interconnected systems), any problem with a set of complex geometric relationships is appropriate for GNNs. While the output of GNNs are typically embeddings (graph topologies embedded in the feature space), some problems require different approaches such as functions or more formal representations.

It is the analysis of these graphical relationships which make it a useful analytical approach. In all their forms, GNNs yield useful representations of graph data partly because they take into consideration the intrinsic symmetries of graphs, such as invariance and equivariance of graph topology with respect to a relabeling of the nodes [2]. Based on what was featured at LoG, GNNs had many potential applications in the biological arena, including precision medicine, drug discovery, and characterizing molecular systems (such as Stefan Gunnemann's (Technical University of Munich) talk in the Friday session).


GNNs can be evaluated using the isomorphism (or k-WL) test, which evaluates whether two graphs are isomorphic. Given that a graph can be drawn from the source data, the source data graph should be isomorphic with the output graph. The Weisfeiler-Lehman heuristic for graph isomorphism can be summarized in the 1-D case as the color refinement algorithm. A related issue in GNN research is algorithmic expressiveness. Expressivity is the breadth of ideas that can be represented and communicated using a particular type of representation. One current challenge of GNNs as they are applied to various problem domains is their ability to be functionally robust. One solution to this is by using GNNs as a generative model. Generating alternate graph representations allows us to use graphons [3], functions that capture different GNN topologies of the same type. The collection of graphs associated with a graphon can then be evaluated. Soledad Villar's (Johns Hopkins) presentation during the Sunday session featured an in-depth discussions of expressiveness and graphons as they relate to GNN performance.


GNNs can be combined with various analytical techniques traditionally used in complex network analysis. One of these involves the analysis of graphical models using tools from network science. These include the use of random graphs and stochastic block models to uncover the presence of topological structure and community formation, respectively. GNNs have ties to category theory as well. The cats.for.ai workshop (October 2022) featured applications of category theory to GNNs. In the Saturday session, Taco Cohen (Qualcomm AI) discussed how the techniques of category theory, monads in particular, can be applied to GNNs. GNNs can also form directed acyclic graphs (DAGs), which are amenable to causal models. 


GNNs are constructed using a series of inferential techniques. One technique discussed at LoG is message passing neural networks (MPNNs). Discrete forward passes from node to node (along edges) allow for approximation of the true, original network topology to be reconstructed. MPNN is a standard technique that lends itself to a wide variety of problem domains. The MPNN approach [4] can be extended to directed multigraphs and other types of graphs that capture complex systems, but can suffer shortcomings such as over-smoothing, over-squashing and under-reaching. While message passing has been the standard in the GNN field, continuous methods using approaches inspired by differential geometry and algebraic topology might serve as powerful alternatives [5]. Aside from approximations of real-world networks and graph-like structures, we can also think of GNN outputs in terms of time (capturing delays) and space (capturing translations). GNNs are also well-suited to mapping problems from algorithmic domains, in particular dynamic programming [6].


GNNs are particularly useful for task-specific architectures. The DevoWorm group’s D-GNN work (DevoGraph) is an example of this, being specialized for embryogenetic image processing or capturing biological growth and differentiation processes. But GNNs can also engage in transfer learning, which is the transfer of learned information from one context to another. Successful graph transfer learning is characterized by the reproduction of a graph of a similar but different size, or problems that require changes in network size over time.


From "Do we need deep graph neural networks?" by Michael Bronstein, Towards Data Science, July 20, 2020.


Workshops

Several of the workshops were particularly interesting with respect to some of the points mentioned above. There were also a number of outstanding oral presentations and posters not discussed here, but are worth checking out in the daily session recordings or on OpenReview.


Neural Algorithmic Reasoning (video). GNNs serve as excellent processors (neural networks in latent space) that can be aligned with more traditional algorithms [7]. This recasts many optimization problems as neural representation learning, particularly in cases where optimization algorithms do not represent the system being analyzed in a realistic manner.


Expressive GNNs (video). This tutorial covers a range of techniques that can be used to increase the expressivity of GNNs. Borrowing from areas such as topological data analysis and group theory, there is great potential for a variety of highly effective strategies for improving GNN architectures for a host of problems.


Graph Rewiring (video, web). Graph rewiring is presented as a way to overcome the limitations of the MPNN approach. Rewiring is based on the reconstruction of graph edges from iterative adaptive sampling of the input data. There are a number of different techniques that allow us to evaluate edge relevance using techniques such as diffusion and spectral approaches.


GNNs on TensorFlow (video). This tutorial introduces nascent modelers to implementing their own GNN models in the open-source TF-GNN framework. The tutorial uses heterogeneous input data to show how to implement the GNN and deal with missing label and edge information.


References

[1] Sanchez-Lengeling, B., Reif, E., Pearce, A., and Wiltschko, A.B. (2021). A Gentle Introduction to Graph Neural Networks. Distill, doi:10.23915/distill.00033.


[2] Chen, Z., Villar, S., Chen, L., and Bruna, J. (2019). On the equivalence between graph isomorphism testing and function approximation with GNNs. Proceedings of Neural Information Processing Systems, 32.

[3] Ruiz, L., Chamon, L.F.O., and Ribeiro, A. (2020). Graphon Neural Networks and the Transferability of Graph Neural Networks. arXiv, 2006.03548.

[4] Heydari, S. and Livi, L. (2022). Message Passing Neural Networks for Hypergraphs. arXiv, 2203. 16995.

[5] Bronstein, M. (2022). Beyond Message Passing: a Physics-Inspired Paradigm for Graph Neural Networks. The Gradient, May 7.

[6] Dudzik, A. and Velickovic, P. (2022). Graph Neural Networks are Dynamic Programmers. arXiv, 2203.15544.

[7] Velickovic, P. and Blundell, C. (2021). Neural Algorithmic Reasoning. arXiv, 2105.02761.

October 8, 2020

Multidimensional Chess Convoluted to a Pretty Picture

At last Monday's DevoWorm Group meeting, I gave a short lecture on ways to interpret multidimensional data using PCA, tSNE, and UMAP.  Here are the slides (below) and the YouTube link. The focus here is on Developmental Molecular Biology, but are generally useful, particularly for comparing methods. Here are the slides with a bonus from Leland McInnes, one of the originators of the UMAP technique!

Click to enlarge.

Click to enlarge.

Click to enlarge.

Click to enlarge.

Click to enlarge.

Click to enlarge.

Click to enlarge.

Click to enlarge.

Click to enlarge.

Click to enlarge.

Click to enlarge.

Click to enlarge.

Click to enlarge.

Click to enlarge.

Click to enlarge.

Click to enlarge.

Click to enlarge.

Click to enlarge.

October 25, 2019

OAWeek: share your own case study!

This post is part of a series published over the course of OAWeek 2019.


Do you use, share, or have an opinion about open data? The Data Reuse Initiative would like to hear from you! In honor of OAWeek 2019, we are looking for personal and research group testimonials on how you share or otherwise practice open data. Submit at your leisure (there is no deadline), but we would like to hear from you!

RULES:
* submit a testimonial (under 200 words) by submitting a pull request to our Github repository or submit to this Google Form.

* if you choose to submit an image (screenshot, diagram, or cartoon), please issue a pull request on Github.

* if you cannot access either of the links, or need help with your submission, please [contact us](mailto:balicea@openworm.org).

October 24, 2019

OA Week: Digital Badges on Open Data

This post is part of a series published over the course of OAWeek 2019. Today's post will preview a series of digital badges related to Data Reuse. These badges were designed in conjunction with the new Data Reuse Initiative.


Overview of Data Reusability I. Click to enlarge.

The first digital badge (Data Reusability I) provides the learner with some practical skills in data sharing. The practical examples are mostly biology-oriented, but is useful for learners from a wide range of fields. Activities include work with a selected article from the journal Genome Biology, posting a sample data set to Figshare, and working with data sets published on the Dryad repository. While these activities provide just a taste of the work involved in sharing data, it nonetheless imparts some key skills in interacting with and publishing data in an open fashion. 


Overview of Data Reusability II. Click to enlarge.

The second digital badge (Data Reusability II) provides a tutorial that reviews public data sharing competencies in more depth. For this set of exercises, we have used the Mozilla Data Sharing Planning Template as a model for best practices community standards. Earners of this badge will develop competencies in metadata creation, data cleaning/processing, documenting data set provenance, assigning credit for the published work, and enabling easy and reproducible reuse of the data set. Check them out!

October 22, 2019

OA Week: History of Open Access

This post is part of a series published over the course of OAWeek 2019.

Timeline of scientific output from [1]. Click to enlarge.

This post will walk us through the History of Open Access (with a focus on Open Science) infographic mentioned in our inaugural blog post for this series. Randall Munroe [1] has previously summarized the progression of open science as a function of the scope of scientific output. The events and milestones for the featured historical overview were confirmed by internet search and synthesized from a survey of various tools and publications common in the field. This post characterizes the historical eras according to a developmental biology theme: from the embryo to developmental plasticity to an adult stage of life-history.

History of Open Access (1942-present), color-coded by historical era. Yellow: early, blue: transitional, green: contemporary. Click to enlarge. For a citable version and an alternate display type, please see [2].

1942-1999: Embryonic Ideas and Tools (early). Click to enlarge.


In the early period, there was an emergence of tools, ideas, and attempts to synthesize independent efforts. Early efforts such as the World Data System, MedLine, and Project Gutenberg served as inspiration for later efforts (particularly the development of MedLine into PubMed). Tools such as digital preprints (arXiv) and the internet (HTML, XML) served to provide the infrastructure of open science. Even tools such as Cyc (extraction of scientific rules from data) served to enable greater openness in the practice of science. The end of this era is marked by "Exploring the Development of the Independent, Electronic Scholarly Journal", a survey of open access journals in what coincides with the early internet era.


2000-2008: Institutional Plasticity (transitional). Click to enlarge.


The transitional period (or institutional plasticity) was a time for creating many of the institutions and established norms of the open science community. Many foundational ideas were either established (Creative Commons, digital object identifiers) or came to fruition (Human Genome Project) during this period. It is also of note that at least four declarations of practice were published during this period.


2009-present: A Juvenile No More! (contemporary). Click to enlarge.


The contemporary period has been defined by even more sophisticated tools (Altmetrics), quasi-historical summaries of past work for future development (Reinventing Discovery, The Future of OA), and the discussion of institutional standards at a greater level of specialization (FAIR Principles). This era is also marked by the use of open science to practice collaborative open science (Polymath Project), putting all of the pieces developed in previous eras into place.

NOTES:
[1] Munroe, R. (2013). The Rise of Open Access. Science, 342(6154), 58-59. doi:10.1126/science. 342.6154.58

[2] Alicea, B. (2019). History of Open Access Infographic. Figshare, doi:10.6084/m9.figshare. 9975713

October 21, 2019

Open Access Week 2019: Introduction

Welcome to OAWeek 2019! This year's features are being published in conjunction with the Orthogonal Research and Education Laboratory, the eLife Ambassadors program, and the associated Data Reuse Initiative.

The first feature for this year is an infographic called the History of Open Access [1]. Our history begins in 1943 with some Philosophy of Science [2], and proceeds through key innovations, publications, and institutions the span the late 20th and early 21st centuries. Below is a preview of the infographic, and will be discussed in more detail on Tuesday the 22nd.

History of Open Access infographic (Omega version).

The second feature is a series of digital badges (microcredentials) on Open Data practice [3]. The first badge in the series walks the learner through several lessons on how to identify, locate, and work with open datasets. The second badge walks the learner through preparing an open data set for publication. This lesson is based on the Mozilla Data Reuse Planning Template which help people adhere to best practices when making data public and shareable. These badges will be released on Thursday the 24th. Then, on Friday the 25th, we will give you the chance to make your own contributions (details to come). So join us for our week of celebrating Open Access!


NOTES:
[1] Figshare, doi:10.6084/m9.figshare.9975713

[2] Robert Merton, The Sociology of Science: theoretical and empirical investigations.

[3] Molloy, J.C. (2011). The Open Knowledge Foundation: Open Data Means Better Science. PLoS Biology, 9(12), e1001195.

December 22, 2017

Fault-tolerant Christmas Trees (not the live kind)

It's an interconnected Christmas scene, but that's not a Christmas Tree! (?) COURTESY: Andrew P. Wheeler.

This year's holiday season post brings a bit of graph-theoretic cheer. That's right, there is a type of network called a Christmas tree [1,2]! It is a class of fault-tolerant Hamiltonian graph [2,3]. So far, Christmas trees have been applied to computer and communications networks, but may be found to have a wider range of applications, particularly as we move into the New Year.


An example of a Christmas Tree directed graph as shown in [2]. The top two graphs are slim trees of order 3 (left) and 4 (right). A Christmas tree (bottom) includes selected long-range connections (longer than the immediate connection to mother, daughter, or sister nodes).

This tree could have used a bit more fault-tolerance!

NOTES:
[1] Hsu, L-H and Lin, C-K (2008). Graph Theory and Interconnection Networks. CRC Press, New York.

[2] Hung, C-N, Hsu, L-H, and Sung, T-Y (1999). Christmas tree: A versatile 1-fault-tolerant design for token rings. Information Processing Letters, 72(1–2), 55-63.

[3] Wang, J-J, Hung, C-N, Tan, J.J-N, Hsu, L-H, and Sung, T-Y (2000). Construction schemes for fault-tolerant Hamiltonian graphs. Networks, 35(3), 233-245.

October 27, 2016

Open Access Week: Working with Secondary Datasets

This is one of two posts in celebration of Open Access week (on Twitter: #oaweek, #open access, #OpenScience #OpenData). This post will focus on the use of secondary data in scientific discovery.


The analysis of open datasets has become a major part of my research program. There are many sources of secondary data, from web scraping [1] to downloading data from repositories. Likewise, there are many potential uses for secondary data, from meta-analysis to validating simulations [2]. If sufficiently annotated [3], we can use secondary data for purposes of conducting new analyses [4], fusion with other relevant data, and data visualization. Access to secondary (and tertiary) data access relies on a philosophy of open data amongst researchers which has been validated by major funding agencies.

The first step in reusing a dataset is to select datasets that are relevant to the question or phenomenon you are interested in. While data reuse is not synonymous with exploratory data analysis, secondary datasets can be used for a variety of purposes, including for exploratory purposes. It is important to understand what data you need to address your set of issues, why you want to assemble the dataset, and how you want to manage the associated metadata [5]. Examples of data repositories include Dryad Digital Repository, Figshare, or the Gene Expression Omnibus (GEO). It is also important to remember that successful data reuse relies on good data management practices to allow for first-hand data to be applied to new contexts [6].

An example of an archived dataset from the Dryad repository (original analysis published in doi:10.1098/rsos/150333).

Now let's focus on three ways to reuse data. The simplest way to reuse data is to download and reanalyze data from a repository using a technique not used by the first-hand generators of the data. This could be done by using a different statistical model (e.g. Bayesian inference), or by including the data in a meta-analysis (e.g. surveying the effects size across multiple studies of similar design). Such research can be useful in terms of looking at the broader scope of a specific set of research questions.

The second way is to download data from a repository for the purpose of combining data from multiple sources. This is what is sometimes referred to as data fusion or data integration, and can be done in a number of ways. One way this has been useful in my research has been for comparative analysis, such as computational analyses of gene expression data across different cell types within a species [7], or developmental processes across species [8]. Another potential use of recombined data is to verify models and validating theoretical assumptions. This is a particular concern for datasets that focus on basic science.

In fact, the recent technological and cultural changes associated with increased data sharing is enabling broader research questions to be asked. Instead of asking strictly mechanistic questions (what is the effect of x on y), combined datasets enable larger-scale (e.g. systems-level) comparisons (what are the combinatorial effects of all x and all y) across experiments. Doing this in a reductionist manner might take many orders of magnitude more time than assembling and analyzing a well-combined dataset. This allows us to verify the replicability of single experiments, in addition to applying statistical learning techniques [9] in order to find previously undiscovered relationships between datasets and experimental conditions.

The third way is to annotate and reuse data generated by your own research group [10]. This type of data reuse allows us to engage in data validation, test new hypotheses as we learn more about the problem, and comparing across different ways to attack the same problem. The practice of data reuse within your own research group can encourage research continuity that transcends turnover in personnel, encouraging people to make data and methods open and explicit. Internal data reuse also educational opportunities, such as providing students with hands-on opportunities to analyze and integrate well-characterized data. Be aware that reusing familiar data still requires extensive annotation of both the data and previous attempts at analysis, and that there is of yet no culturally-coherent set of standard practices for sharing data [11].


There are a few caveats with respect to successfully using data. As is the case with experimental design, the data should be sufficient to answer the type of questions you would like to answer. This includes going back to the original paper and associated metadata to understand how the data was collected and what it was originally intended to measure. While this does not directly limit what you can do with the data, it is important to understand in terms of combining datasets. There is a need for ways of assessing internal validity for secondary datasets, whether they be single data sources or combinations of data sources.

To learn more about these techniques, please try to earn the Literature Mining badge series hosted by the OpenWorm badge system. You can earn Literature Mining I (working with papers), or both Literature Mining I and II (working with secondary data). Here you will learn about how to use secondary data sources to address scientific questions, as well as the interrelationship between the scientific literature and secondary data sources.


NOTES (Try accessing the paper dois through http://oadoi.org):

[1] Marres, N. and Weltevrede, E. (2012). Scraping the Social? Issues in live social research. Journal of Cultural Economy, 6(3), 313-315. doi:10.1080/17530350.2013.772070

[2] Sargent, R.G. (2013). Verification and validation of simulation models. Journal of Simulation, 7(1), 12–24. doi:10.1057/jos.2012.20.

[3] For an example of how this has been a consideration in the ENCODE project, please see:
Hong, E.L., Sloan, C.A., Chan, E.T., Davidson, J.M., Malladi, V.S., Strattan, J.S., Hitz, B.C., Gabdank, I., Narayanan, A.K., Ho, M., Lee, B.T., Rowe, L.D., Dreszer, T.R., Roe, G.R., Podduturi, N.R., Tanaka, F., Hilton, J.A., and Cherry, J.M. (2016). Principles of metadata organization at the ENCODE data coordination center. Database, pii:bav001. doi: 10.1093/database/bav001.

[4] Church, R.M. (2001). The Effective Use of Secondary Data. Learning and Motivation, 33, 32–45. doi:10.1006/lmot.2001.1098.

[5] One example of this includes: Kyoda, K., Tohsato, Y., Ho, K.H.L., and Onami, S. (2014). Biological Dynamics Markup Language (BDML): an open format for representing quantitative biological dynamics data. Bioinformatics, 31(7), 1044-1052. doi: 10.1093/bioinformatics/ btu767

[6] Fecher, B., Friesike, S., and Hebing, M. (2015). What drives academic data sharing? PLoS One, 10(2), e0118053. doi:10.1371/journal.pone.0118053.

[7] Alicea, Bradly (2016): Dataset for "Collective properties of cellular identity: a computational approach". Figshare, doi:10.6084/m9.figshare.4082400

[8] Here is an example of a comparative analysis based on data from two secondary datasets: Alicea, B. and Gordon, R. (2016). C. elegans Embryonic Differentiation Tree (10 division events). Figshare, doi:10.6084/m9.figshare.2118049 AND Alicea, B. and Gordon, R. (2016). C. intestinalis Embryonic Differentiation Tree (1- to 112-cell stage). Figshare, doi:10.6084/m9.figshare.2117152

[9] Dietterich, T.G. Machine Learning for Sequential Data: A Review. Structural, Syntactic, and
Statistical Pattern Recognition, LNCS, 2396. doi:10.1007/3-540-70659-3_2

[10] Federer, L.M., Lu, Y-L., Joubert, D.J., Welsh, J., and Brandys, B. (2015). Biomedical Data Sharing and Reuse: Attitudes and Practices of Clinical and Scientific Research Staff. PLoS One, 10(6), e0129506. doi:10.1371/journal.pone.0129506.

[11] Pampel, H. and Dallmeier-Tiessen, S. (2014). Open Research Data: From Vision to Practice. In "Opening Science", S. Bartling and S. Friesike eds., Pgs. 213-224. Springer Open, Berlin. Dynamic version.

October 24, 2016

Open Access Week: How Am I Doing, Altmetrics?

This is one of two posts in celebration of Open Access week (on Twitter: #oaweek, #open access, #OpenScience). To kick things off, we will go through an informal evaluation of Altmetrics and other indicators of research paper usership.

In this post, I will discuss some quick investigations I did using the Altmetric metric system (known visually as the number within the multicolored donut). Altmetrics go beyond academic metrics based solely on academic journal prestige or number of formal citations in academic papers (e.g. h-index). In this post, I will discuss how these metrics might be used to help better understand the full impact on one's work.


The Altmetric donut and its diversity of input sources. The Altmetric score is based on how many interactions your content received from each source medium.

The first exercise I did was to acquire Altmetric donuts for journal articles and preprints for which I did not have such data. This includes venues such as arXiv, Stem Cells and Development, and Principles of Cloning II, which do not feature Altmetric donuts on their pages. Interestingly, the bioRxiv preprint server does, in addition to tracking .pdf download and abstract view counts.


Example of an Altmetric donut in context (top) and readership stats (bottom) from a recent Biology paper for which I am an author. 

Retrieving a donut and data summary from the Altmetric database is easy. You embed a few line of code (see inset below) into an HTML document, and the donut and score appear where desired. While the donut is most useful for augmenting a publication list, in this case I simply created a test document for collating data from across many papers.

// Formal journal article citation
Alicea, B., Murthy, S., Keaton, S.A., Cobbett, P., Cibelli, J.B., and Suhr, S.T.  Defining phenotypic respecification diversity using multiple cell lines and reprogramming regimens. Stem Cells and Development, 22(19), 2641-2654 (2013).
// Code for donut and database call; possible data subclasses include:
// data-arxiv-id
// data-handle
// data-doi

In context, the donut can provide useful information about how a given paper is diffusing through the academic internet. In the case of the Stem Cells and Development paper (see code), the paper has an Altmetric score of 9. While the Journal website does not have Altmetric or download data, it does provide a doi identifier and select forward citations.


Examples of the Altmetric database entry (top) and the Journal website (bottom) for the Stem Cells and Development paper.

Similar data exist for a follow-up paper to the Stem Cells and Development paper -- in this case, a preprint involving a specialized quantitative analysis (based on Signal Detection Theory) of the same data. For this paper, we have an arXiv identifier, which provides us with a donut and statistics on the relative popularity of the paper based on age and other similar documents in the Altmetric database.

A typical arXiv article page, in this case for an arXiv preprint related to the Stem Cells and Development paper.

This arXiv preprint comes with code for the analysis, which is posted to Github.

For this particular paper, there is an associated Github repository. Even for preprint repositories with Altmetric and readership data (such as bioRxiv), the integration of Github materials is rather poor, particularly in generating an Altmetric. Alternately, there is an opportunity for Github to This is an area for which user statistics linked back to the original paper would be appreciated. 

Altmetrics for the same arXiv preprint. We can access data on the sources of the Altmetric score, as well as the attention score in the context of all other tracked documents in the Altmetrics database.

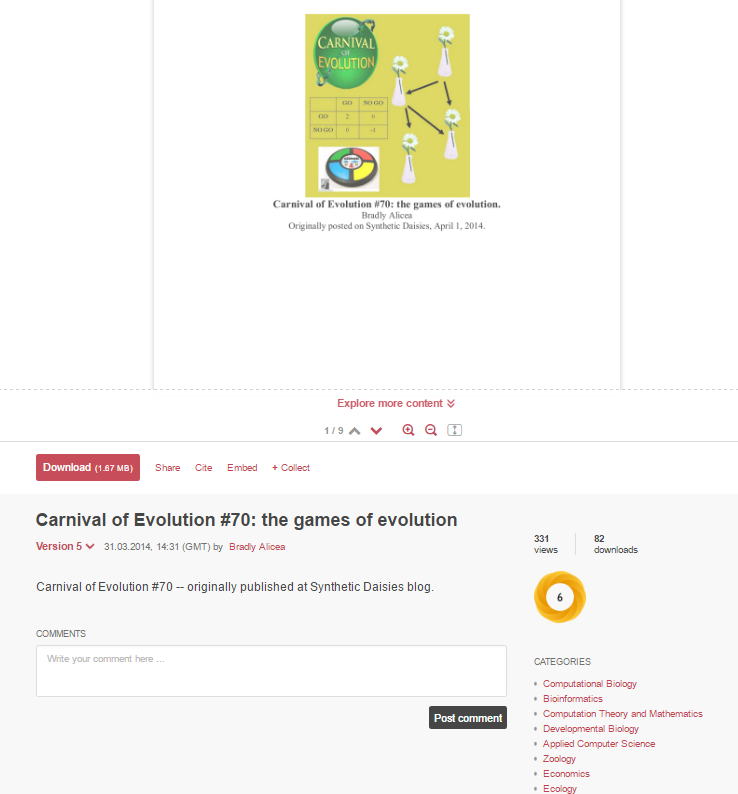
We can also integrate readership data across sources to come up with a picture of how our academic work is being shared, consumed, and diffused. In this example, I will show how data from a blog analytics engine and Altmetric data can be combined. Research blogs are an up-and-coming area of research in Altmetric statistics capture. I have taken two blogrolls (Carnival of Evolution #46 and Carnival of Evolution #70), for which citable versions were posted to Figshare immediately after going live. My blogging platform (Blogger) has readership stats but no Altmetrics, while Figshare has Altmetrics and readership stats for the Figshare version only.


Altmetric data for two blogrolls cross-posted to Figshare, which provides both a doi identifier and an Altmetric donut. There is also view and download information for the Figshare version, which may or may not be inclusive of people viewing such content on the blog site.

Let's look at the Figshare data first. Carnival #46 has an Altmetrics score of 10 with 188 views and 58 downloads. By contrast, Carnival #70 has an Altmetrics score of 6 with 331 views and 82 downloads. Clearly, there is some variation in direct engagement between the two datasets that is proportional to the score.


Readership statistics for Carnival of Evolution #46 (top) and Carnival of Evolution 
#70 (bottom). Blog analytics only provides the number of "reads" on the home site since publication.

There is also little relationship between the number of Blogger reads and the Altmetric score (as the Altmetric score does not directly capture this number). Carnival #46 has 7928 reads over roughly 4 years and 7 months. Carnival #70 has 1602 reads over roughly 2 years and 7 months. 

Even in cases where no Altmetric donut can be generated (such as for book chapters), there are still ways to evaluate an article's reach. In the case of Academia.edu, a new feature has been added that allows people to leave a comment when they interact with a document. This is a more qualitative assessment of engagement, but also provides authors an idea of whether or not "reads" or "views" translate into more than just a passing glance.

Two consumers of a book chapter took time to express their gratitude. Other reasons can be quite interesting as well, particularly when they have to do with educational purposes.

Hope you have enjoyed this exercise. It is not meant to be an exhaustive discussion of the Altmetric evaluation system, nor is it the limit of what can be done with Altmetrics and other tools for tracking you work. While there is clearly more technical work to be done on this front, tools such as Altmetric APIs are available. The biggest challenge is to building a social economy based on a variety of research outputs. The field is moving quite rapidly, so what I have shown here is likely to be just the beginning. 

Printfriendly